Half Measures

Canada began to go metric in the ’70s. Fifty years ago. Look at the following flyer from 2020. What do you notice?

Baby back ribs are on sale for $11.00/kg but it’s the price per pound that’s front and centre. Same for strawberries. So you might think that imperial units are the norm at the grocery store. But sockeye salmon is on sale for $3.29/100 g. Note that the unit in this unit price is not 1 kilogram but 100 grams. Okay, so meat and produce are (prominently) imperial and seafood is metric. Why this difference? Maybe, to the Canadian consumer, $4.99 per pound feels less than $11.00 per kilogram. Then why not go all the way and advertise $1.10/100 g? The next stop is the deli where corned beef goes for $2.99/100 g. This time, meat is metric. Potato salad, too. To summarize, (fresh) meat and produce are imperial whereas seafood and (deli) meat and salads are metric. Potatoes are priced per pound — unless in a picnic salad. And this is just at the grocery store.

The Fresh St. flyer is typical of everyday life in Canada. Today, social distancing signs remind citizens to stay 2 metres, or 6 feet, apart. Canadians are fluent with both. This is not true of linear measures across all contexts. When driving or walking, I think kilometres or metres. After all, all roads signs were metric a good ten years before I began to drive. One lap around my school’s track was–still is–400 m, my “How far of a walk is it?” referent. Two metres and six feet are interchangeable when it comes to social distancing but a person’s height requires more precision and, thus, smaller units. So centimetres and inches it is, right? Nope. Feet and inches. Metres and centimetres are reserved for driver’s licenses and other official documents. Similar for a person’s weight, by the way.

Volume? Litres of gas but gallons of paint. In a restaurant or pub, a pint (20 imperial fluid ounces) or a bottle (341 millilitres) of beer, a five-ounce glass or a half-litre of wine. Temperature? Celsius for weather, Fahrenheit when cooking.

There are generational and provincial differences but I’m in line with the majority of Canadians.

This system of two systems of measurement can partly be explained by our proximity to the US. But there’s more to it. Conversion means new benchmarks and referents. And the old ones are sticky…

When thinking about a person’s height, six feet means something to me whereas 183 cm does not. Right away, I connect 6′ with the short side of tall or the tall side of average. Not so for 1.83 m. One hundred eighty-three centimetres could go about becoming a new benchmark in one of two ways: like milk or like butter. Milk is sold in 4 L jugs. Milk didn’t just slap a 3.89 L label on a gallon jug and call it a day. A new number, a new referent. (Remember milk bags? Blame metrification.) Butter, on the other hand, is sold in 454 g (i.e., still 1 lb) blocks. I can’t think 1 lb without also thinking 0.454 kg. I don’t foresee that happening to 6′ and 1.83 m. Two–in place of 1.83–metres isn’t helpful outside of the NBA. One hundred eighty centimetres has a nice ring to it and, at what we think of as 5’11”, would probably a better barometer of short or tall.

I will never not know that a National Hockey League (NHL) rink is 200 feet long, a measure set in cement by the phrase “a bad penalty 200 feet from his own net.” No Canadian hockey fan would ever use metres when talking about The Game. The length of a Canadian Football League (CFL) field is 110 yards, a noticeably non-metric number. This places midfield at the fifty-FIVE-yard-line, which is just awkward. Here’s the thing: 110 yards is 100.58 metres. That’s so close to one-hundred. Mathematically, I’d like to see a metric field. Even in a game of inches, a change from 100.58 to 100 metres would be negligible. Differences in downs would be more significant: 1st and 10 (metres) would be 1st and 10.94 (yards). (Still three downs to gain them.)

I can move fluently between outside temperatures of 20 ℃/68 ℉ or above; below I’m subtracting thirty and dividing by two. Zero–not 32–is my freezing temperature. But those baby back ribs above? 275 degrees Fahrenheit, low and slow. Pizza? 450 ℉. These numbers resist being replaced — they are “baked” in.

For a long time, Canadian curriculum was mandated to be metric. Imperial units were part of everyday life but not school life, real-world math but not school math. Fortunately, the imperial system of measurement has found a place in BC’s mathematics curriculum. Unfortunately, that place is Workplace Mathematics 10. This means that not all students in BC are taught imperial alongside metric. Learning imperial serves a purpose greater than “talking with Americans”; it’s part of Canadian culture.

Many teachers, however, still believe that all curricular materials must be metric. If, in a workshop, I pose a problem with imperial units, I promise that at least one colleague will point it out. But there are much more important questions to ask when evaluating tasks than “Are the units metric?”:

  • Is the task engaging?
  • Is it aligned with grade-level content?
  • Does the problem require problem solving?
  • Does it help students develop conceptual understanding or procedural fluency?
  • Does it have multiple solutions or allow multiple approaches?
  • Does it encourage discourse?

Consider Andrew Stadel’s File Cabinet three-act math task (surface area; Grade 8). Six enthusiastic yeses to the questions above. Live with the inches in Act 2. Or take the classic maximize area given a fixed perimeter/minimize perimeter given a fixed area tasks (Grade 5). Why give your students 1-inch square colour tiles to model these problems but not talk about the dimensions of the manipulatives? Be flexible in earlier grades. Say “they’ll need it for high school” if you get any pushback. (You won’t.)

Tasks that ask students to make comparisons or justify decisions lend themselves to using mixtures of units. For example, take a moment to think about the heights of the following action film actors.

Arrange the actors from shortest to tallest.

Like your students, you probably placed the Toms–Cruise and Holland–on the left, Dwayne Johnson and Jason Momoa on the right. I can provide you with measurements and ask “How confident are you now?”

How confident are you now? Which comparisons were easy? Which were more difficult?

Note that it’s easy to make two comparisons: Dwayne Johnson is taller than Tom Cruise; Jason Momoa is taller than Tom Holland. (If you–or one of your students–lacked this bit of pop culture knowledge, you’re now up to speed.) These comparisons involve converting within systems of measurement: inches to feet and centimetres to metres (or vice versa). Comparing Johnson with Momoa and Cruise with Holland is more challenging; it demands converting between systems: metres or centimetres to feet or inches (or vice versa). This elicits an essential mathematical understanding: using the same unit to measure different objects makes it easier to compare these objects.

Would you rather…? math tasks also provide opportunities for students to learn imperial alongside metric. For example,

Would you rather…
(A) run a half-marathon or
(B) take part in a 20K run?

Would you rather…
(A) drive from Vancouver to Montreal (4554 km) or
(B) drive from San Francisco to New York (2903 mi)?

For $1500/mo, would you rather…
(A) rent a 280 square foot apartment in Manhattan or
(B) rent a 28 square metre flat in London?

Would you rather…
(A) buy a vehicle with a fuel economy rating of 7.7 L/100 km or
(B) buy a vehicle that gets 33 mpg?

Would you rather…
(A) get gas at home or
(B) go to the US for gas?

Caught in some eternal flexed-arm hang

Next to your comrades in the national fitness program
Caught in some eternal flexed-arm hang
Droppin’ to the mat in a fit of laughter
Showed no patience, tolerance or restraint

The Tragically Hip, “Fireworks”

My memory is (not) muddy

If, like me, you were a kid in Canada in the ’70s or ’80s, you remember the “national fitness program.” To The Hip’s fanbase, this is not some obscure cultural reference. Millions participated. Operated by the Government of Canada, the Canada Fitness Award Program consisted of six events: flexed-arm hang, shuttle run, partial curl-ups, standing long jump, 50 m run, and endurance run. These events were proxies for strength, power, speed, agility, and cardiovascular/aerobic endurance — not to mention “patience, tolerance, or restraint.” The flexed-arm hang test timed how long you could hang still from a pull-up bar with your chin at or above the bar. Some lasted seconds, some over a minute. I excelled in this event despite never being mistaken for having “arm and shoulder girdle strength.” Did this test favour the scrawny?

That’s not 130°.

I remember these signs. Even today, I could draw you a map of my elementary school gym, placing each event in the right spot.

This was a national fitness test. Results were mailed to the government who, in turn, sent awards to schools. Badges — bronze, silver, gold, and excellence — or <shudders> plastic participation pins were distributed to my “comrades” and me.

Fifty-mission caps

I remember getting silver. No muddiness in that memory. I remember being disappointed with bronze. I remember gold, too. But that might have been my brother.

I always suspected that this program was a response to the Summit Series — a close-call that threatened our national identity. It is, after all, the backdrop to “Fireworks”: “If there’s a goal that everyone remembers, it was back in ol’ 72.”

Crisis of faith and crisis is the Kremlin

I completely forgot about Canada’s Sputnik: The 60-year-old Swede.

Anyway Susan

But this is a math ed blog, not a personal journal. What does the Canada Fitness Award Program have to do with teaching and learning? There are some takeaways with respect to my district’s “priority practices”: curriculum design, quality assessment, instructional strategies, and social and emotional learning.

Hung with pictures of our parents’ prime ministers

Today I learned the flexed-arm hang was discontinued and replaced by push-ups. “The revised program was distributed to all schools in March 1980.” Not all, not all, not all! Not my school. When I do the math, the flexed-arm hang should never have been part of my fitness evaluation. Seven-year-old me should have just missed it. But I didn’t. Year after year, I took this test. So why did it persist? The easy answer is that my teacher missed the memo.

It’s not that easy.

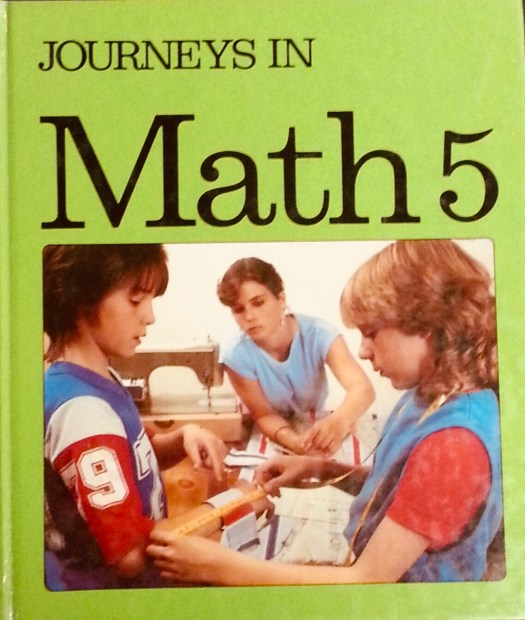
Curriculum is weird in that it can mean standards, resources, or “the lived daily experience of young people in classrooms.” Here, I’m going to interpret curriculum as learning resources (aligned with learning standards and impacting students’ learning experiences). Take a moment to look at the textbook below. In what year was it published?

They don’t know how old I am. They found armour in my belly.

1987.

The photo on the cover threw me. I estimated earlier — “You could say I became chronologically ‘Fucked-Up’.” I’m confident that someone somewhere in BC is using Journeys today. Right now. Not in a you-can-find-good-problems-in-every-textbook kind of way but as the core math resource in their classroom. Ten years ago, stories of teachers hiding them over the summer break so that their administrators wouldn’t take and replace them with Math Makes Sense or Math Focus were common. Some student, somewhere in BC, has been assigned a (long out of print) textbook that could have been assigned to their parents.

Fake. But it’s possible.

This speaks to the difficultly in implementing change in education (and is not intended to pile on an individual teacher’s choice of instructional materials). It’s never just about new learning standards or resources. Swapping out a laminated flexed-arm hang poster for a push-up one is one thing. Changing PE practices is quite another. (Knowing that adding and subtracting fractions has moved from Math 7 to Math 8 while multiplying and dividing integers has moved from Math 8 to Math 7 is today’s equivalent to swapping station signs. This knowledge is one click away.)

With new curriculum comes new instructional strategies for teachers to learn. These new strategies may butt up against entrenched models of teaching (e.g., flipping the “I Do, We Do, You Do” script). Teaching is a cultural activity. New curriculum may usher in new values and beliefs. Pushback is predictable. A teacher who see mathematics as answer-getting will resist resources aimed at mathematics as sense-making. Lasting change often takes a teacher reframing their own relationship with and understanding of mathematics. Teachers need patience, time, and support to think about new ideas and put them into practice.

This is all nothing but cold calculation

By 1992, the Canada Fitness Award Program was discontinued in part because its focus on performance and awards discouraged those it most intended to motivate (i.e., those lacking physical fitness or those deemed to be overweight). Such a program wouldn’t fly today. Now that we know better, we do better, right?

You can probably guess where I’m going with this…

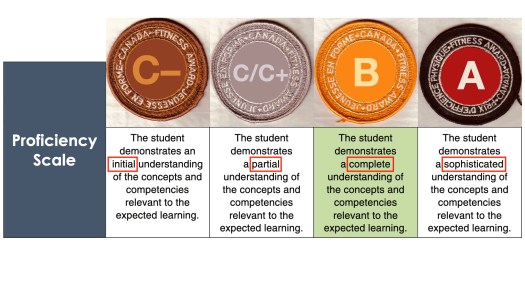
BC’s Ministry of Education lays out four levels of proficiency in terms of evaluating students’ learning: Emerging, Developing, Proficient, and Extending. Initial, partial, complete, and sophisticated are supposed to be helpful descriptors.

Most teachers comment that this is far too vague. Many of those teachers are creating descriptions of these proficiency levels for both curricular competencies (or their headings) and content. Consider the following example from my colleague, Marc Garneau. For “use strategies to solve problems,” he takes into account differences in the two parts of this standard: use of strategies and types of problems.

These efforts are designed to focus on learning. These teachers want to communicate learning to students and their families in meaningful ways. But they are also tasked with reporting letter grades (or percentages). So they hold their noses and find imperfect work-arounds. Still, it can be a real challenge to convince students that Emerging, Developing, Proficient, and Extending are anything but badges.

For the purpose of illustration only. Not intended as a recommendation.

Note: This topic deserves a deeper dive. See our Numeracy Support During COVID-19 site for a start.

Another (smaller) assessment takeaway…

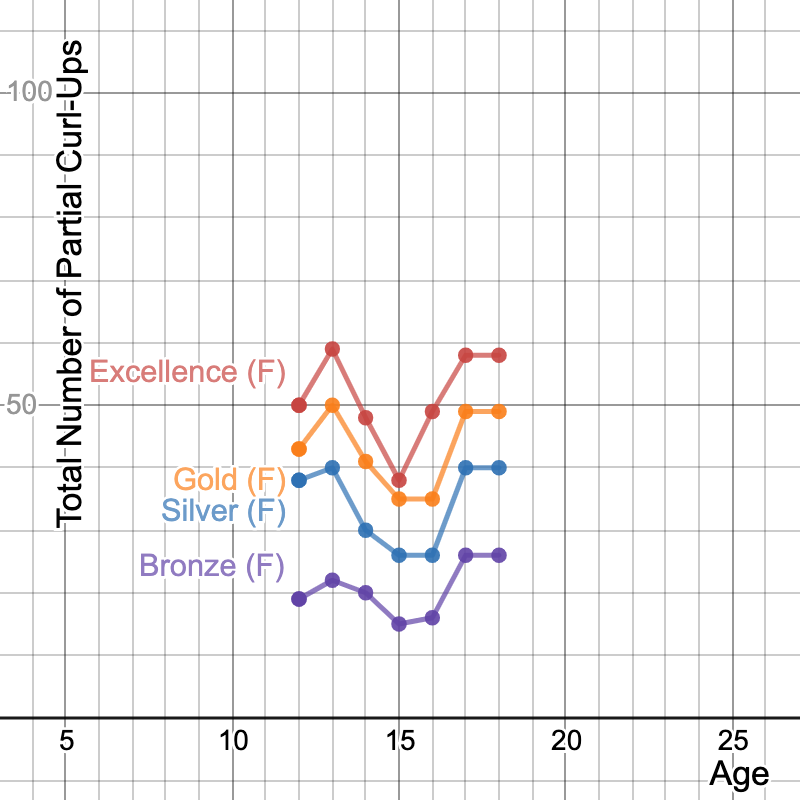
I remember the Canada Fitness Award Program norms being almost arbitrary. I couldn’t find any flexed-arm hang details but the Royal Canadian Air Cadets adopted the (revised) program. Check out the graphs below for partial curl-ups. What do you notice? What do you wonder?

I notice a lot of ups and downs. At 13, the total number partial curl-ups required for boys to achieve Gold or Excellence is at a minimum; at 15, a maximum. The opposite is true for girls. Probably puberty except these differences don’t always appear at the same ages — or at all — when looking across events. Thirty-seven partial curl-ups would have placed a 12- and 15-year-old girl one shy of the 38 cut-off for silver and excellence, respectively. This difference feels as arbitrary as the difference between 86 (A) and 85 (B).

Play with the graph here. I’m curious what students might notice and wonder. The FitnessGram PACER Test (or “Beep Test”) will be more relevant in their real worlds. How does it compare? (Confession: all this time I thought it was the “Fitness Graham Pacer Test.”)

We get to feel small. But not out of place at all.

My sense is that PE classes have changed a lot since the days of flexed-arm hangs. There seems to be a greater emphasis on personal health and fitness — noble goals of the Canada Fitness Award Program — and less of the sportsball rotation of volleyball, basketball, badminton, rugby, repeat. No more pedagogy of winning-team-stays-on (and losing-team-takes-a-seat). There seems to be more personalized ways to achieve success.

Again, what does this mean for the teaching and learning of mathematics? In terms of a long-held practice with a lasting legacy, the “Mad Minute” is the closest match from math class. Its focus on speed discourages those it most intends to motivate (i.e., those without quick recall of the basic facts). We know that timed tests cause math anxiety. We know that there are more effective — and less destructive! — ways to develop fact fluency. See here, here, here, here, or here.
Each year, I’m invited to present a workshop to a teacher candidate cohort at a local university. And each year, they share their figurative vaccination scars left by math class. For every PE teacher who was awarded a red and black badge, there’s a math teacher who was an “Around the World” champ. “But some kids like it” misses the point and one more “I turned out okay” isn’t going to change my mind. I’ve been down this road before; it’s my eternal flexed-arm hang.

Two-Legged, Four-Legged, Winged, Finned: Patterns from Indigenous Art

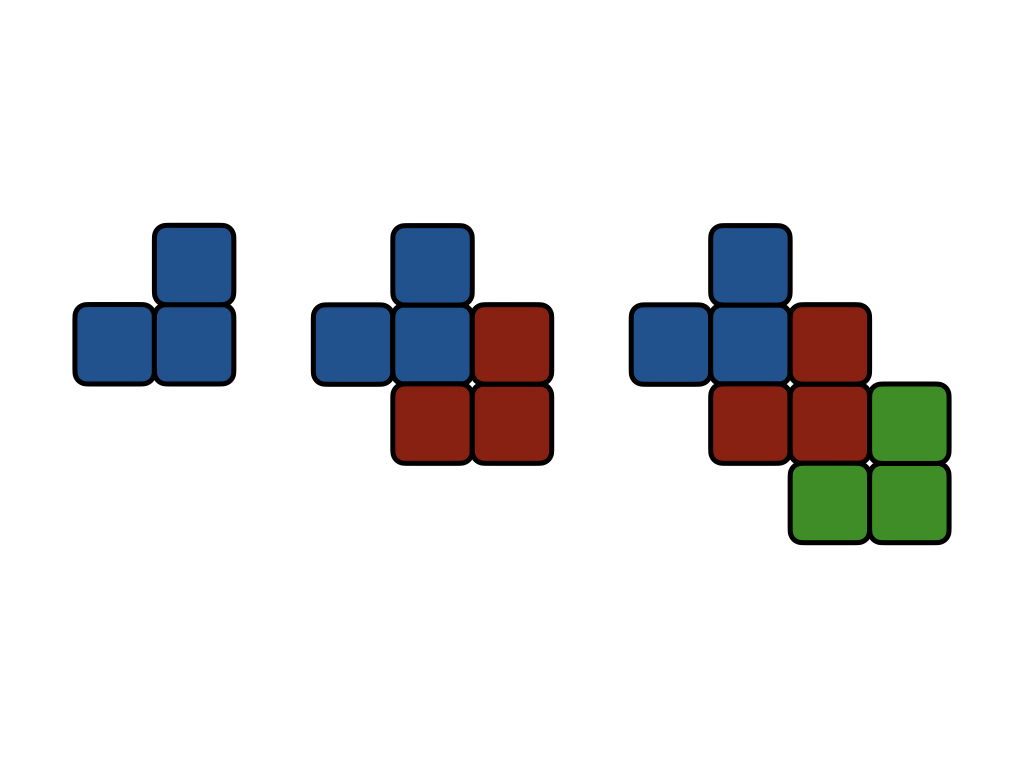
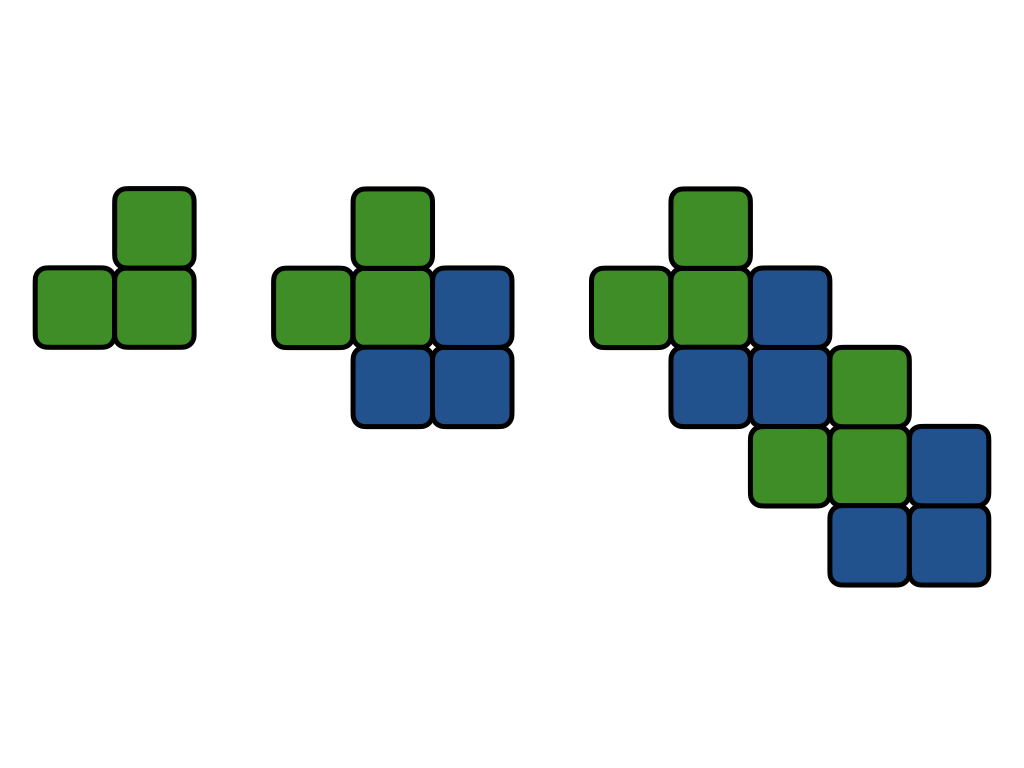
Back when we were all together, I’d often stop on my way in or out of DEC to play with the 3-D printed First Nation shapes on display. These manipulatives were a collaboration between Nadine McSpadden (Aboriginal Helping Teacher), Eric Bankes (ADST Helping Teacher), and the Bothwell Elementary community (Bea Sayson, Principal). Like others who passed by, I just had to rearrange them to create repeating patterns or symmetric designs.

Photo: Nadine McSpadden

Before having students explore mathematics using these materials, it’s important to first teach the cultural significance of Indigenous works of art. In Surrey, we work and learn on the unceded shared territories of the Coast Salish. We acknowledge the Katzie, Semiahmoo, and Kwantlen First Nations who have been stewards of this land since time immemorial. 

Students should understand that, although there are similarities, not all First Nation art is the same. Both Coast Salish and Northwest Coast art reflect a worldview of connection to the land and environment. There are differences in design: Coast Salish artists use three geometric elements — the circle (or oval), crescent, and trigon — whereas Northwest Coast artists use formline — the ovoid and U-shape. The use of circles, crescents, and trigons is unique to the Coast Salish! These elements suggest movement and make use of positive and negative space. In his video covering Coast Salish design, Shaun Peterson invites viewers to “imagine a calm body of water enclosed by two borders and dropping a pebble in to create ripples that carry the elements away from the centre.” Just as there is diversity within both Coast Salish and Northwest Coast peoples, there is diversity within both Coast Salish and Northwest Coast art (e.g., compare the Northwest Coast styles of the Haida and the Tsimshian).

Patterns play an important role in aboriginal art and technology. Coast Salish art could provide opportunities for students’ across the grades (and into Pre-calculus 12!) to expand their ideas about “what repeats.” Dylan Thomas is a Coast Salish artist from the Lyackson First Nation whose work in silkscreen prints, paintings, and gold and silver jewelry is influenced by Buddhist imagery and M.C. Escher’s tessellations (see Mandala or The Union of Night and Day or Salmon Spirits or Ripples or Swans or…). Share this video in which Dylan Thomas talks about connections between geometry, nature, and art as well as the importance of noticing and wondering (4:00-4:40) with your students. In Mandala, Pythagoras — or a ruler — tells us that the ratios of successive diameters of circles or side lengths of squares is √2:1. Have your students investigate this relationship. This illustrates that sometimes it’s the repetition of a rule that makes a pattern a pattern. To learn more about the artist’s interest in mathematics, I recommend reading his essay on the topic. Now is a perfect time to remind students of protocols: students should not replicate a specific piece but can instead create their own piece that is “inspired by…” or “in the style of…”; if displayed, an information card acknowledging the artist, their Nation, and their story should be included.

I’m really interested in geometry and the reason I think I am is geometry is nature’s way of producing really intricate and beautiful things. I hope that when someone sees one of my pieces they see the correlation between what I designed and what you see in nature, these sacred geometries that have shown up in nature since life evolved. And I’m hoping that when they can look at my piece they can take that wonder into their everyday life and start noticing the things that I notice and the things that inspire me.

Dylan Thomas

My numeracy colleague, Jess Kyle, recently created a lesson around the 3-D shapes above to teach students about Coast Salish culture and repeating patterns with multiple attributes (shape, colour, orientation). I wanted to expand on this lesson and zoom out from these shapes to the animal forms seen in Coast Salish art. These animals — two-legged, four-legged, winged, and finned — are connected to the land. I’m imagining these math investigations within a classroom where learners understand that animals were and continue to be an important part of the lives (and art) of First Peoples. For example, see Maynard Johnny Jr., Coast Salish, Kwakwaka’wakw, talk about his work Ate Salmon, its past-tense play-on-words title displaying humour while addressing the effects of overfishing and stock depletion on Indigenous communities (3:00-4:00). In many First Nations, certain animals are significant or sacred to the teachings, histories, and beliefs of that Nation. Each will have their own protocols around ways in which these animals are portrayed. In some parts of British Columbia animals appear on crests and regalia while in other parts of Canada animals are sacred gifts from the ancestors.

The City of Surrey has commissioned several public Indigenous works of art. Four Seasons, by Brandon Gabriel and Melinda Bige, Kwantlen First Nation, is located in the Chuck Bailey Recreation Centre. 

Photo: City of Surrey

I have some mathematical noticings and wonderings but, again, it’s important to first teach the cultural context and meaning.

Throughout this cancellation of in-class learning due to COVID-19, Surrey’s cultural facilitators have been creating and sharing videos to show and discuss with your students. Chandra Antone, Squamish First Nation, shares her teachings about drumming with us in the videos “Honour Song” and “Animal Hides.” As well, Surrey’s Aboriginal Learning Helping Teachers have generated sets of questions to ask your students about each of these videos.

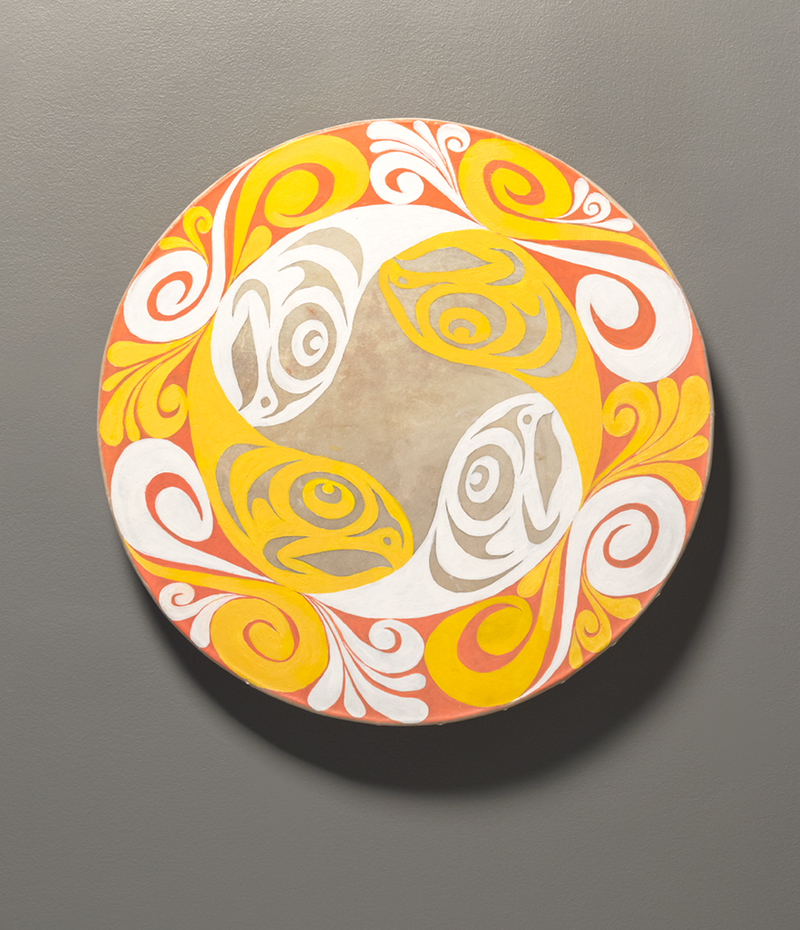
Display images (below) of the four drums and ask “What do you notice? What do you wonder?”

Students might notice the blues, greens, yellows/whites, and reds/oranges; they might wonder if these colours represent winter, spring, summer, and fall. They might notice the moons (“Why just two?”), two wolves, four salmon, and trees/leaves and wonder how they tell the story of the four seasons. They might also wonder “How big are they?” (30”), “What are the drums made of?” (buffalo hide) or “Who is the artist?” Introduce your students to Mr. Gabriel through this video:

We wanted to make sure that we captured the essence of the space that we were in, that Surrey didn’t begin as Surrey, that its beginnings are much more ancient and go back many more years than the current incarnation of it. This place is very special for Indigenous people — it was also home to multiple Indigenous communities that were established here for thousands of years — so we wanted to make sure that we were honouring those people in a way that was respectful and dignifying to them. We thought, what can we use as part of the narrative that we’re going to tell with these drums that not only speaks to the Indigenous community that’s always been here but to the people who now call this place home?

Brandon Gabriel

Students may also make many mathematical observations. For example:

  • in the winter drum, there is line symmetry
  • in the summer and fall drums, there is rotational symmetry
  • in the spring drum, there is line symmetry in (just) the moon and rotational symmetry in (just) the surrounding running water design
  • in the summer drum, there are two repeating yellow-white patterns (salmon and border)
Line Symmetry
Rotational Symmetry

Again, students should not replicate Four Seasons but can instead draw their own symmetric piece that is “inspired by/in the style of Brandon Gabriel and Melinda Bige, Kwantlen First Nation.” Challenge students to use pattern blocks to build designs that satisfy mathematical constraints such as:

  • has more than three lines of symmetry
  • has rotational but not line symmetry
  • has oblique — not horizontal or vertical — lines of symmetry
  • order of rotation is three/angle of rotation is 120°
inspired by Four Seasons, Brandon Gabriel and Melinda Bige, Kwantlen First Nation

For more symmetry in Surrey Public Indigenous Art, seek out and visit:

Like night following day (or moon following sun), the cyclical changing of the seasons is something that young children can connect to when introduced to the concept of patterns. With changes in the seasons comes changes in their own lives. This is an opportunity for students to learn how seasonal and environmental changes impacted the village of qəyqə́yt (now known as Bridgeview) and continue to impact the lives of First Nations peoples today.

We Are All Connected to This Land by Phyllis Atkins, Kwantlen First Nation, is installed on a small bridge on King George Highway spanning Bear Creek. The design features three salmon (one male, one female, one two-spirited), a sun, an eagle, a moon, and a wolf, cut from powder-coated red aluminum and mirrored on both sides of the bridge.

Phyllis Atkins at blessing ceremony for We Are All Connected to This Land
Photo: Surrey Now-Leader
Photo: City of Surrey

The animals are described on the artwork’s page on the City of Surrey website:

“Salmon are resilient creatures that make an arduous journey to return to their freshwater spawning grounds, such as Bear Creek, to give new life and sustain eagles, bears, wolves, and people. The wolf represents the teacher and guide of the Kwantlen People while the eagle flying closest to the sun is carrying prayers to the Creator. The inclusion of Grandfather Sun and Grandmother Moon contrast day and night and indicate the passage of time.”

Teachers should avoid giving “meaning” to each animal as it often leads to appropriating spirit animals. Instead, ask “Can you think of characteristics of each animal that might be important?”

What if these figures were the core of a pattern? What if, like Nadine’s 3-D shapes at the top of this post, we could pick up and play with these figures? We could create repeating patterns like salmon-eagle-wolf or finned-winged-4legged. We’re not limited to left-to-right patterns arranged in a line. Different displays of patterns will bring to light different patterns. For example:

AB

Maybe this example better illustrates this idea:

ABBC three ways

In the second and third arrangements I interrupted the black-red-red-white pattern core in the first row to offset the pattern in subsequent rows. What (new) patterns can you find? What would the fourth arrangement look like? What’s the pattern in the patterns? Like the idea of patterns as “ripples that carry the elements away from the centre” above this structure provides us with new ways of thinking about the core of a pattern: we can think in terms of repeating vertical columns just as we would if we were bead looming. (To learn more about bead looming, please register for Nelson’s Culturally Responsive Math webinar series. It’s free!)

Teachers can use First Nation rubber stamps — available from Strong Nations — to explore repeating patterns of animal images. While we strive to embed local content, this is not always possible so we may blend Coast Salish and Northwest Coast art.

AAB

A playful approach is to begin a pattern — say wolf, raven, … — and ask “What comes next?” Some students will suspect an AB pattern and predict wolf. Others will suspect that you’re trying to trick them by not revealing the entire pattern core; they might predict raven (ABB) or orca (ABC). Ask “How confident are you?” Repeat this a few times. Suppose that you’ve revealed wolf, raven, wolf, raven, wolf, raven. By now, students will be very confident that wolf will come next. Mess with them: add bear instead. Ask students “What’s my pattern rule? Would you like to revise your thinking?” and have them share their conjectures. Next, add eagle. Can students identify the pattern as 4legged-winged? And what if we throw colour or orientation into the mix? Multiple attributes can add ambiguity to pattern tasks. Invite students to use these stamps to create their own repeating patterns.

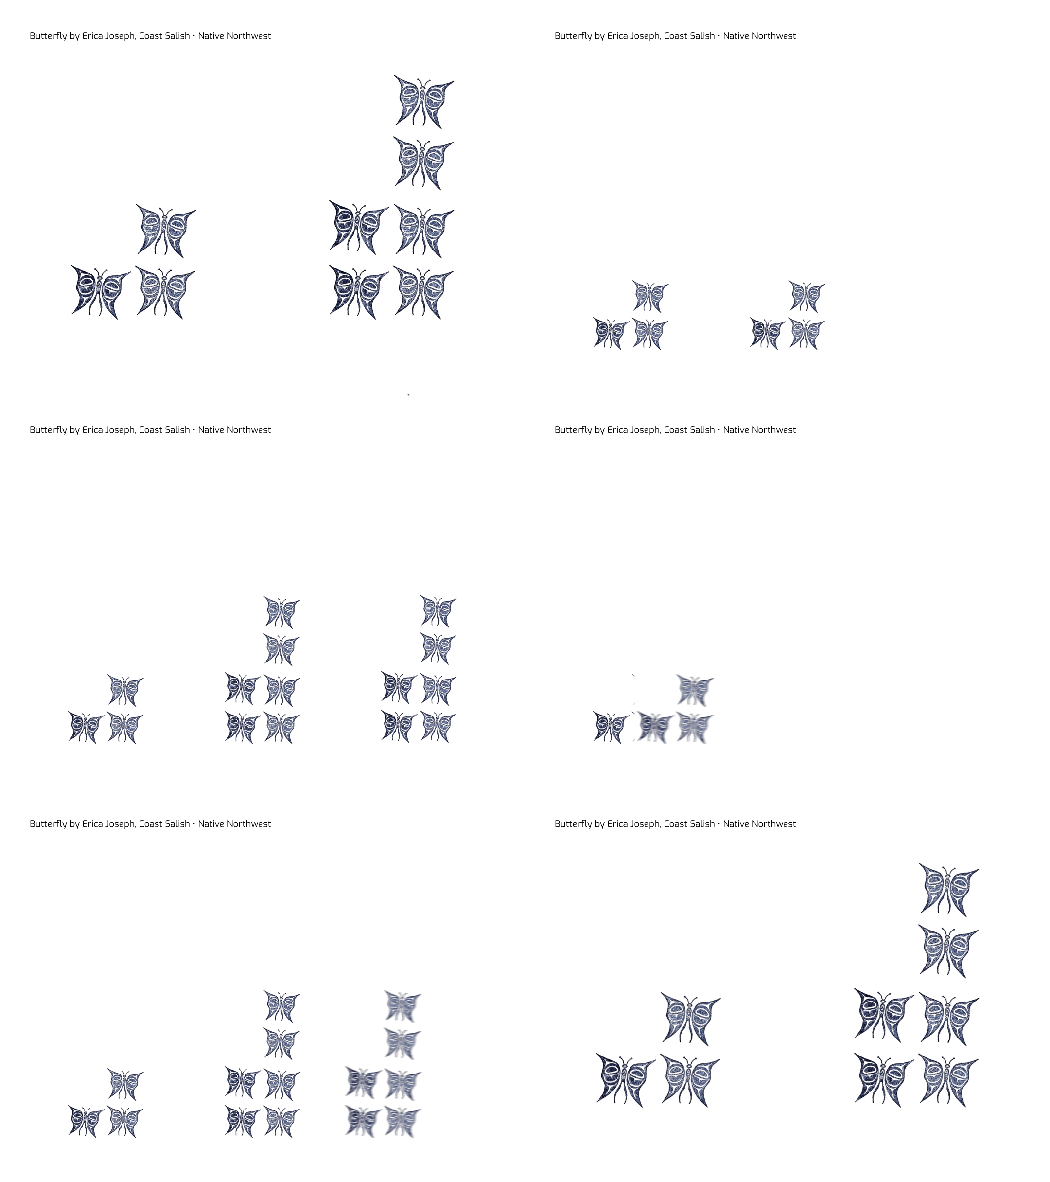
Beginning in Grade 2 (and continuing into Grade 10), students learn about increasing patterns. In Grade 2, it is expected that students describe the salmon pattern below as “start at 3 and add 1 each time”; in the upper intermediate grades, students describe the pattern as n + 2; and in Foundations of Math and Pre-Calculus 10, this is formalized as slope (or rate of change) and y-intercept (or constant).

3, 4, 5, …

Presenting only the first and second terms of a pattern is another way to add ambiguity. (For example, “Extend the pattern 5, 10, … in as many ways as you can.️”) I’ve been playing with this approach to visual patterns. Take a moment to consider the pattern below. What comes next? What else might come next?

You might have noticed that three tiles were added and imagined a linear pattern — 3n as either n groups of three or three groups of n:

You might have saw this as doubling and visualized an exponential pattern — 3(2)ⁿ ⁻ ¹:

Or you might have spotted squares and pictured a quadratic pattern — n² + 2:

In later grades, these more complex patterns (quadratic, exponential, triangular numbers, Fibonacci) can be introduced. Again, there’s a chance to spotlight First Nations art. Here’s a different arrangement of 3, 6, …

What comes next? What else might come next?

(If there’s a way to see a quadratic pattern in this arrangement, I can’t make it out.)

I’m more than a bit apprehensive about sharing these last two examples. They feel inauthentic: swap in dots for the images of animals above and the task remains the same. However, in using these images and first teaching their cultural significance, I’m hopeful that this communicates my respect for First Nations culture, especially to Indigenous learners (and outweighs my concerns about curriculum design).

Huy ch q’u Nadine McSpadden and Heidi Wood for continuing to help me make connections between the cultural practices and perspectives of First Peoples and the teaching and learning of mathematics.

Updates

Four-legged, winged, finned is the context of the following question from our Math 6 Ratios video:

More visual patterns with animals:

2n + 1

Egg, Head, …

Take a moment to think about the following image:

#whatrepeats? #patternchat

What comes next? What comes before? How do you know?

You might have sensed (the start of) a repeating pattern. Whether you considered the materials that make up the egg cups (glass, porcelain, …) or the position of the eggs (down, up, …), it’s a simple AB pattern. Or rather, like 🍀💎🍀💎🍀💎…, two synchronous AB patterns. If you were to extend the pattern, you’d get this:

AB; AB

Not so fast. Check out the video in the following tweet:

An AB pattern is maintained in the materials: still glass-porcelain. But the video hints at a new possible pattern–an ABAA pattern–with respect to the elliptical “dome”: egg-head-egg-egg.

AB; ABAA

Again, not so fast. These first four elements may not be what repeats; they may not be the pattern core. What if the pattern core were instead egg-head-egg-egg-egg-head (all the while still maintaining glass-porcelain)?

AB; ABAAAB

Patterns repeat. Repetition is what makes a pattern a pattern. Sometimes items repeat, sometimes a rule (e.g., add 3 each time) repeats. How would you describe what repeats in the following pattern?

All of these possibilities illustrate that without knowing what repeats, you can’t know for certain what comes next. For example, consider the following open question: Extend the pattern 5, 10, … in as many ways as you can. Common classroom responses include: 5, 10, 5, 10, 5, 10, …; 5, 10, 25, 5, 10, 25, …; 5, 10, 15, 20, 25, …; 5, 10, 15, 25, 40, …; 5, 10, 20, 40, 80, …; etc. (Variation: Extend the pattern ▲◾️… in as many ways as you can.)

The two attributes in the egghead examples–container and “contents”–made the task more interesting. In the classroom, this plays out by looking at repeating patterns with multiple attributes (i.e., colour, shape, size, orientation). Consider the pattern below:

What’s missing?

What’s missing? If you focus on colour, it’s an ABC pattern; it must be teal. If you focus on shape, it’s an AABB pattern; it must be a triangle. If you focus on orientation, it’s an ABBA pattern; it must “sit” on a vertex. If you hold all three asynchronous patterns in your mind, it must be a teal square resting on a vertex (a/k/a “diamond”). But I’m not looking for one right answer. In the classroom, I’d happily accept a teal triangle (or circle) from a student who sees a teal-orange-green pattern; an orange (or purple) square from a student who spots a triangle-triangle-square-square pattern; etc. If the claim is true, the answer is correct.

Pattern Fix-Its present another opportunity for students to examine patterns involving multiple attributes. Here, a pattern is messed with by adding or removing an element, changing one or more attributes of an element, or swapping the order of two adjacent elements. The math picture book Beep Beep, Vroom Vroom by Stuart J. Murphy provides a context: Molly plays with her big brother’s toy cars and must put them back in the right order before he returns. Using this context, I swapped the last two cars in a big-small and yellow-blue-green pattern:

Can you fix it?

Press Here by Hervé Tullet also includes some mixed-up pattern pages. That probably inspired my shaking effect here:

Like Which One Doesn’t Belong?, these questions allow all students to confidently contribute to and benefit from the discussion, whether they notice one or many patterns, whether they attend to simple (colour and shape) or more challenging (orientation) attributes, or whether they examine single or multiple attributes at a time.

* * ** *** ***** ********

I’d be remiss not to include Marc’s tweet somewhere in this post:

Related

A Star Wars Tomatometer Story

I wrote this post two years ago but decided against hitting publish. With the final film in the “Skywalker saga” opening next week, now is as good a time as any. And yes, we have tickets!

Like The Force Awakens and Rogue One, my daughters and I saw The Last Jedi on opening night. It’s become a bit of a Hunter holiday tradition. Gwyneth loves the stories; Keira loves the Porgs. As much as the movies themselves, Gwyneth loves watching and discussing YouTubers’ takes on them — reactions, explanations, theories. She shared this one from New Rockstars with me, which begins with this:

“… Star Wars: The Last Jedi is the most polarizing film of the year, with one of the biggest gaps between critics ratings and audience scores for a major film ever. What the hell is going on here? Why are some people so annoyed with it, saying it ruined what made the original trilogy and The Force Awakens so good? Why are others fanboy crushing so hard over it, calling it the best Star Wars film ever made?”

New Rockstars

This reminded me of another passion of mine: the fundamental meanings of the operations. More specifically, subtraction as difference/comparison rather than take away/removal.

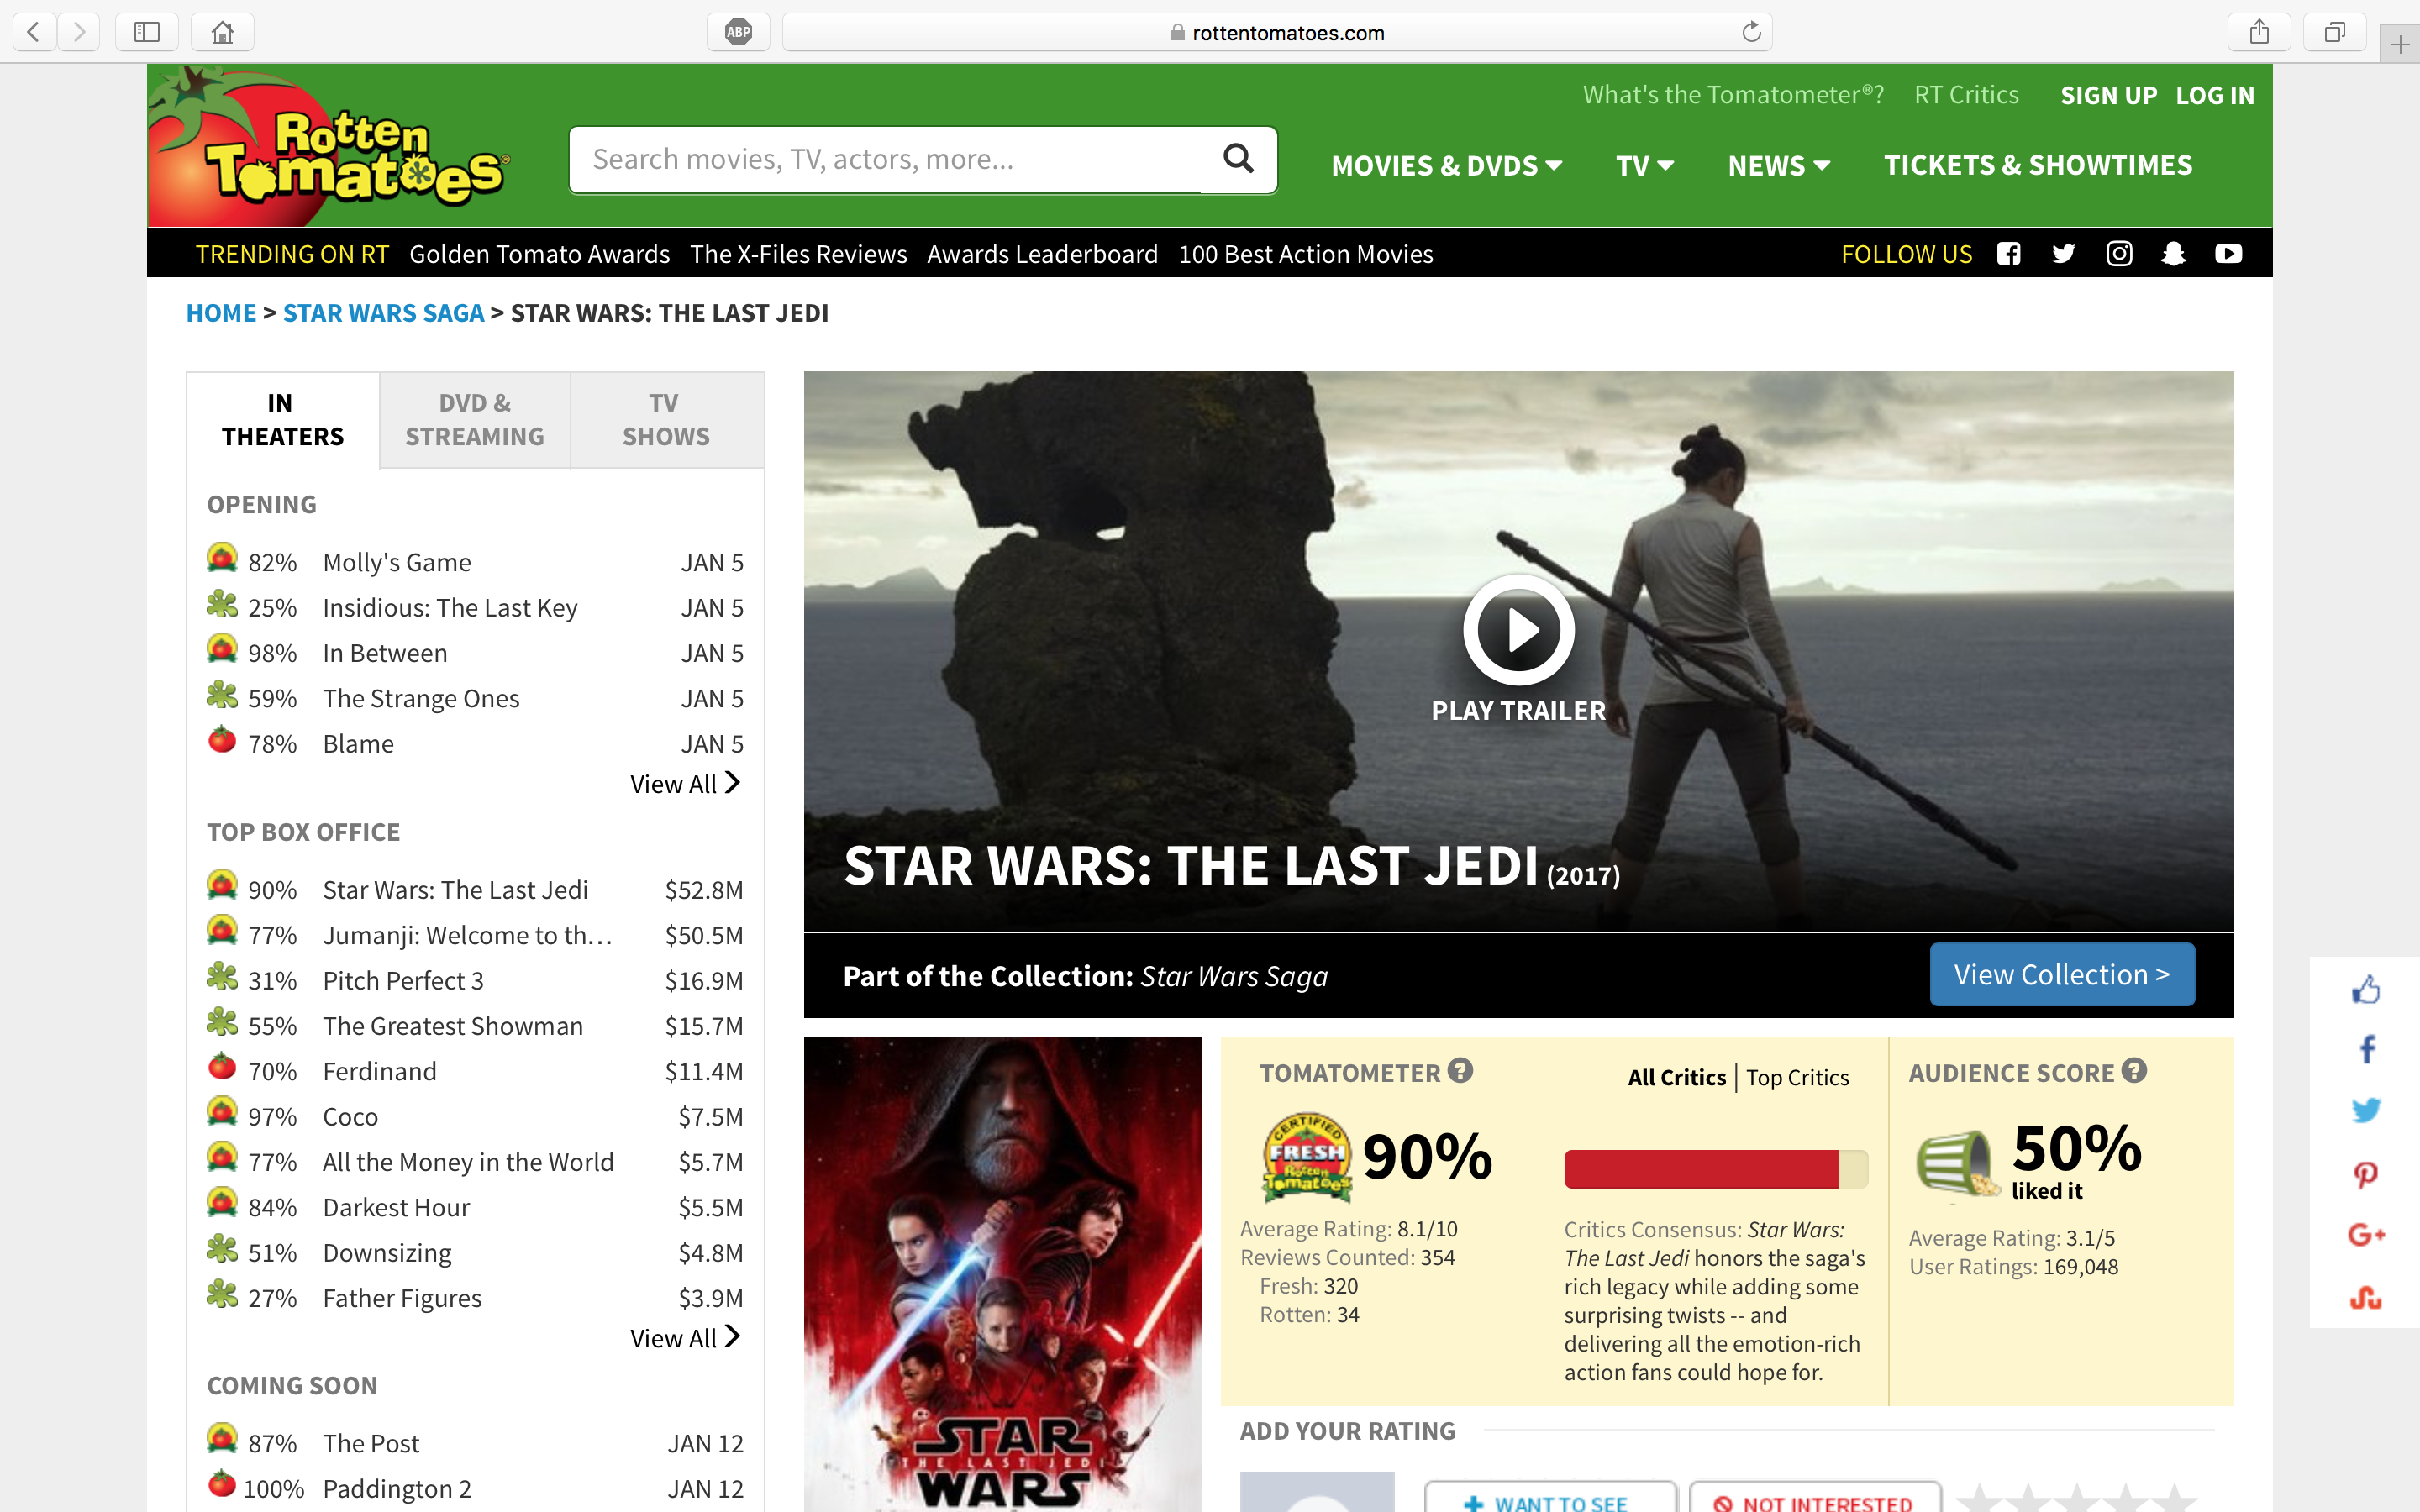
Here are the Rotten Tomatoes scores for The Force Awakens:

Tomatometer -- Episode VIII

Episode I | II | III | IV | V | VI | VII | Rogue One | What is the Tomatometer?

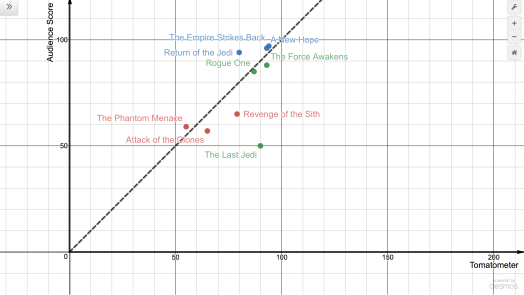
What’s the meaning, in context, of 50 – 90?

We’re measuring the gap between the percentage of professional critics (“Tomatometer rating”) and Rotten Tomatoes users (“Audience Score”) who rate the movie positively. We’re talking comparison, not removal. There’s a difference of 40%. Moreover, the difference here is negative (albeit my minuend/subtrahend decision is kinda arbitrary). This means that The Last Jedi is far less favourable among moviegoers as a group than among professional movie critics. We can compare this gap with that of others in the Star Wars franchise:

Episode IV: A New Hope (1977) → 96 – 93 = +3
Episode V: The Empire Strikes Back (1980) → 97 – 94 = +3
Episode VI: Return of the Jedi (1983) → 94 – 80 = +14
Episode I: The Phantom Menace (1999) → 59 – 55 = +4
Episode II: Attack of the Clones (2002) → 57 – 65 = -8
Episode III: Revenge of the Sith (2005) → 65 – 79 = -14
Episode VII: The Force Awakens (2015) → 88 – 93 = -5
Rogue One: A Star Wars Story (2016) → 85 – 87 = -2
Episode VIII: The Last Jedi (2017) → 50 – 90 = -40

Some patterns emerge. For example, all three films in the original trilogy received positive reviews from critics and audiences alike; all three are Certified Fresh. A greater percentage of Rotten Tomato users than critics liked A New Hope, The Empire Strikes Back, and Return of the Jedi: Audience Score – Tomatometer rating > 0. The Force Awakens and Rogue One received similar positive reviews, again from critics and audiences alike. However, these recent movies rated a little lower among audiences than among critics: Audience Score – Tomatometer rating < 0.

We can use absolute value to measure agreement between the two groups. For A New Hope, The Empire Strikes Back, The Phantom Menace, The Force Awakens, and Rogue One, |Audience Score − Tomatometer rating| ≤ 5. Rotten or fresh, there’s consensus. For The Return of the Jedi and Revenge of the Sith, |Audience Score − Tomatometer rating| = 14. Still, a relatively small difference of opinions.

The Last Jedi breaks this trend. Professional critics place it alongside fellow Disney films The Force Awakens and Rogue One. RT users score it lower than the prequels. Below Binks!

Movies may be more engaging than the usual contexts for integers — a diversion from temperatures and bank balances. Thinking about this data graphically may have more potential.

https://www.desmos.com/calculator/zzplnokx7f

It’s very similar to my take on the food graph, with movie critics in place of nutritionists in the role of expert. Gwyneth played along as I asked “What’s going on in this graph?”. We predicted where some of our favourite movies would land. We explained our reasoning. We compared our predictions with Rotten Tomato data. And then we shut down the laptop and rewatched The Empire Strikes Back.

The data for eight of these nine movies hasn’t changed much in two years. The outlier? Yep, The Last Jedi. The difference is now up to — or down to? — negative forty-eight (Audience Score: 43; Tomatometer rating: 91).

Look-Alike Photos

This summer, Marc and I created a series of videos designed to help parents support their children in Math 8 and 9. As best we could, we tried to have parents actively “do the math” rather than passively consume content. The explorations were meant to simulate the classroom experiences of their children. Here’s one of my favourites…

Display the original photo and five enlargements.

Ask “Which of these photos look the same as the original?” This phrasing is intentionally vague. Have students talk about what it means to “look the same.” Introduce labels — it’ll make conversations easier.

At this stage, no numbers are given. I want learners to use their intuition and get a “feel” for the problem. Tell them not to worry about making an incorrect choice — they’ll get a chance to revise their thinking later on. Likely, they’ll rule out photos B and D. Photo B looks like a square; it looks like photo D has been stretched more horizontally than vertically. Photos A, C, and E are contenders. For example, students might suspect that the dimensions of E are double those of the original. Ask “How confident are you?”

Now is the time for numbers.

Ask “Would you like to revise your thinking? How confident are you now?” The numbers confirm this hunch about photo E (and C). They can also determine close calls, like photo A. Here, scale factors of 0.75 (height_original : width_original) versus 0.8 (height_A : width_A) or 1.25 (width_A : width_original) versus 1.33 (height_A : height_original) prove that photo A is not a true enlargement of the original. (Note that this might surface if students are making absolute rather than relative comparisons: after all, adding 1″ to both the width and height of the original gets us photo A.)

This context can also be used to explore strategies for determining a missing value in a proportion. What if the photo were “posterized”?

Although these videos were designed for parents, we’re hopeful that teachers find them helpful.

Recommended reading: Tracy Zager’s Becoming the Math Teacher You Wish You’d Had (Chapter 9: Mathematicians Use Intuition)

Recommended activity: Desmos’ Marcellus the Giant

Monster Mash(-up)

The blog is going to be a 2013 version of itself for Halloween…

Act 1

Any questions?

  • How many different monsters can you make?

Here, a monster is made up of three cards: head, torso, and legs. In Bears vs Babies, a monster can be just a head or a head with one to four body parts. I’ve simplified the task to get at the fundamental counting principle.

Act 2

What information would be helpful to have here?

  • How many head, torso, and legs cards are there?

Students may want to act this out. Give them these cards. Encourage them to find a systematic way of counting the possibilities. How can the number of monsters be determined from the number of head, torso, and legs cards? Start with heads and torsos, if need be.

Act 3

The reveal…

Introduce tree diagrams. Connect this representation to students’ strategies. These might help:

Sequels

  • You have about 50 monsters in your hand. How many head, torso, and legs cards might you have?

A&W Math

IMG_1951

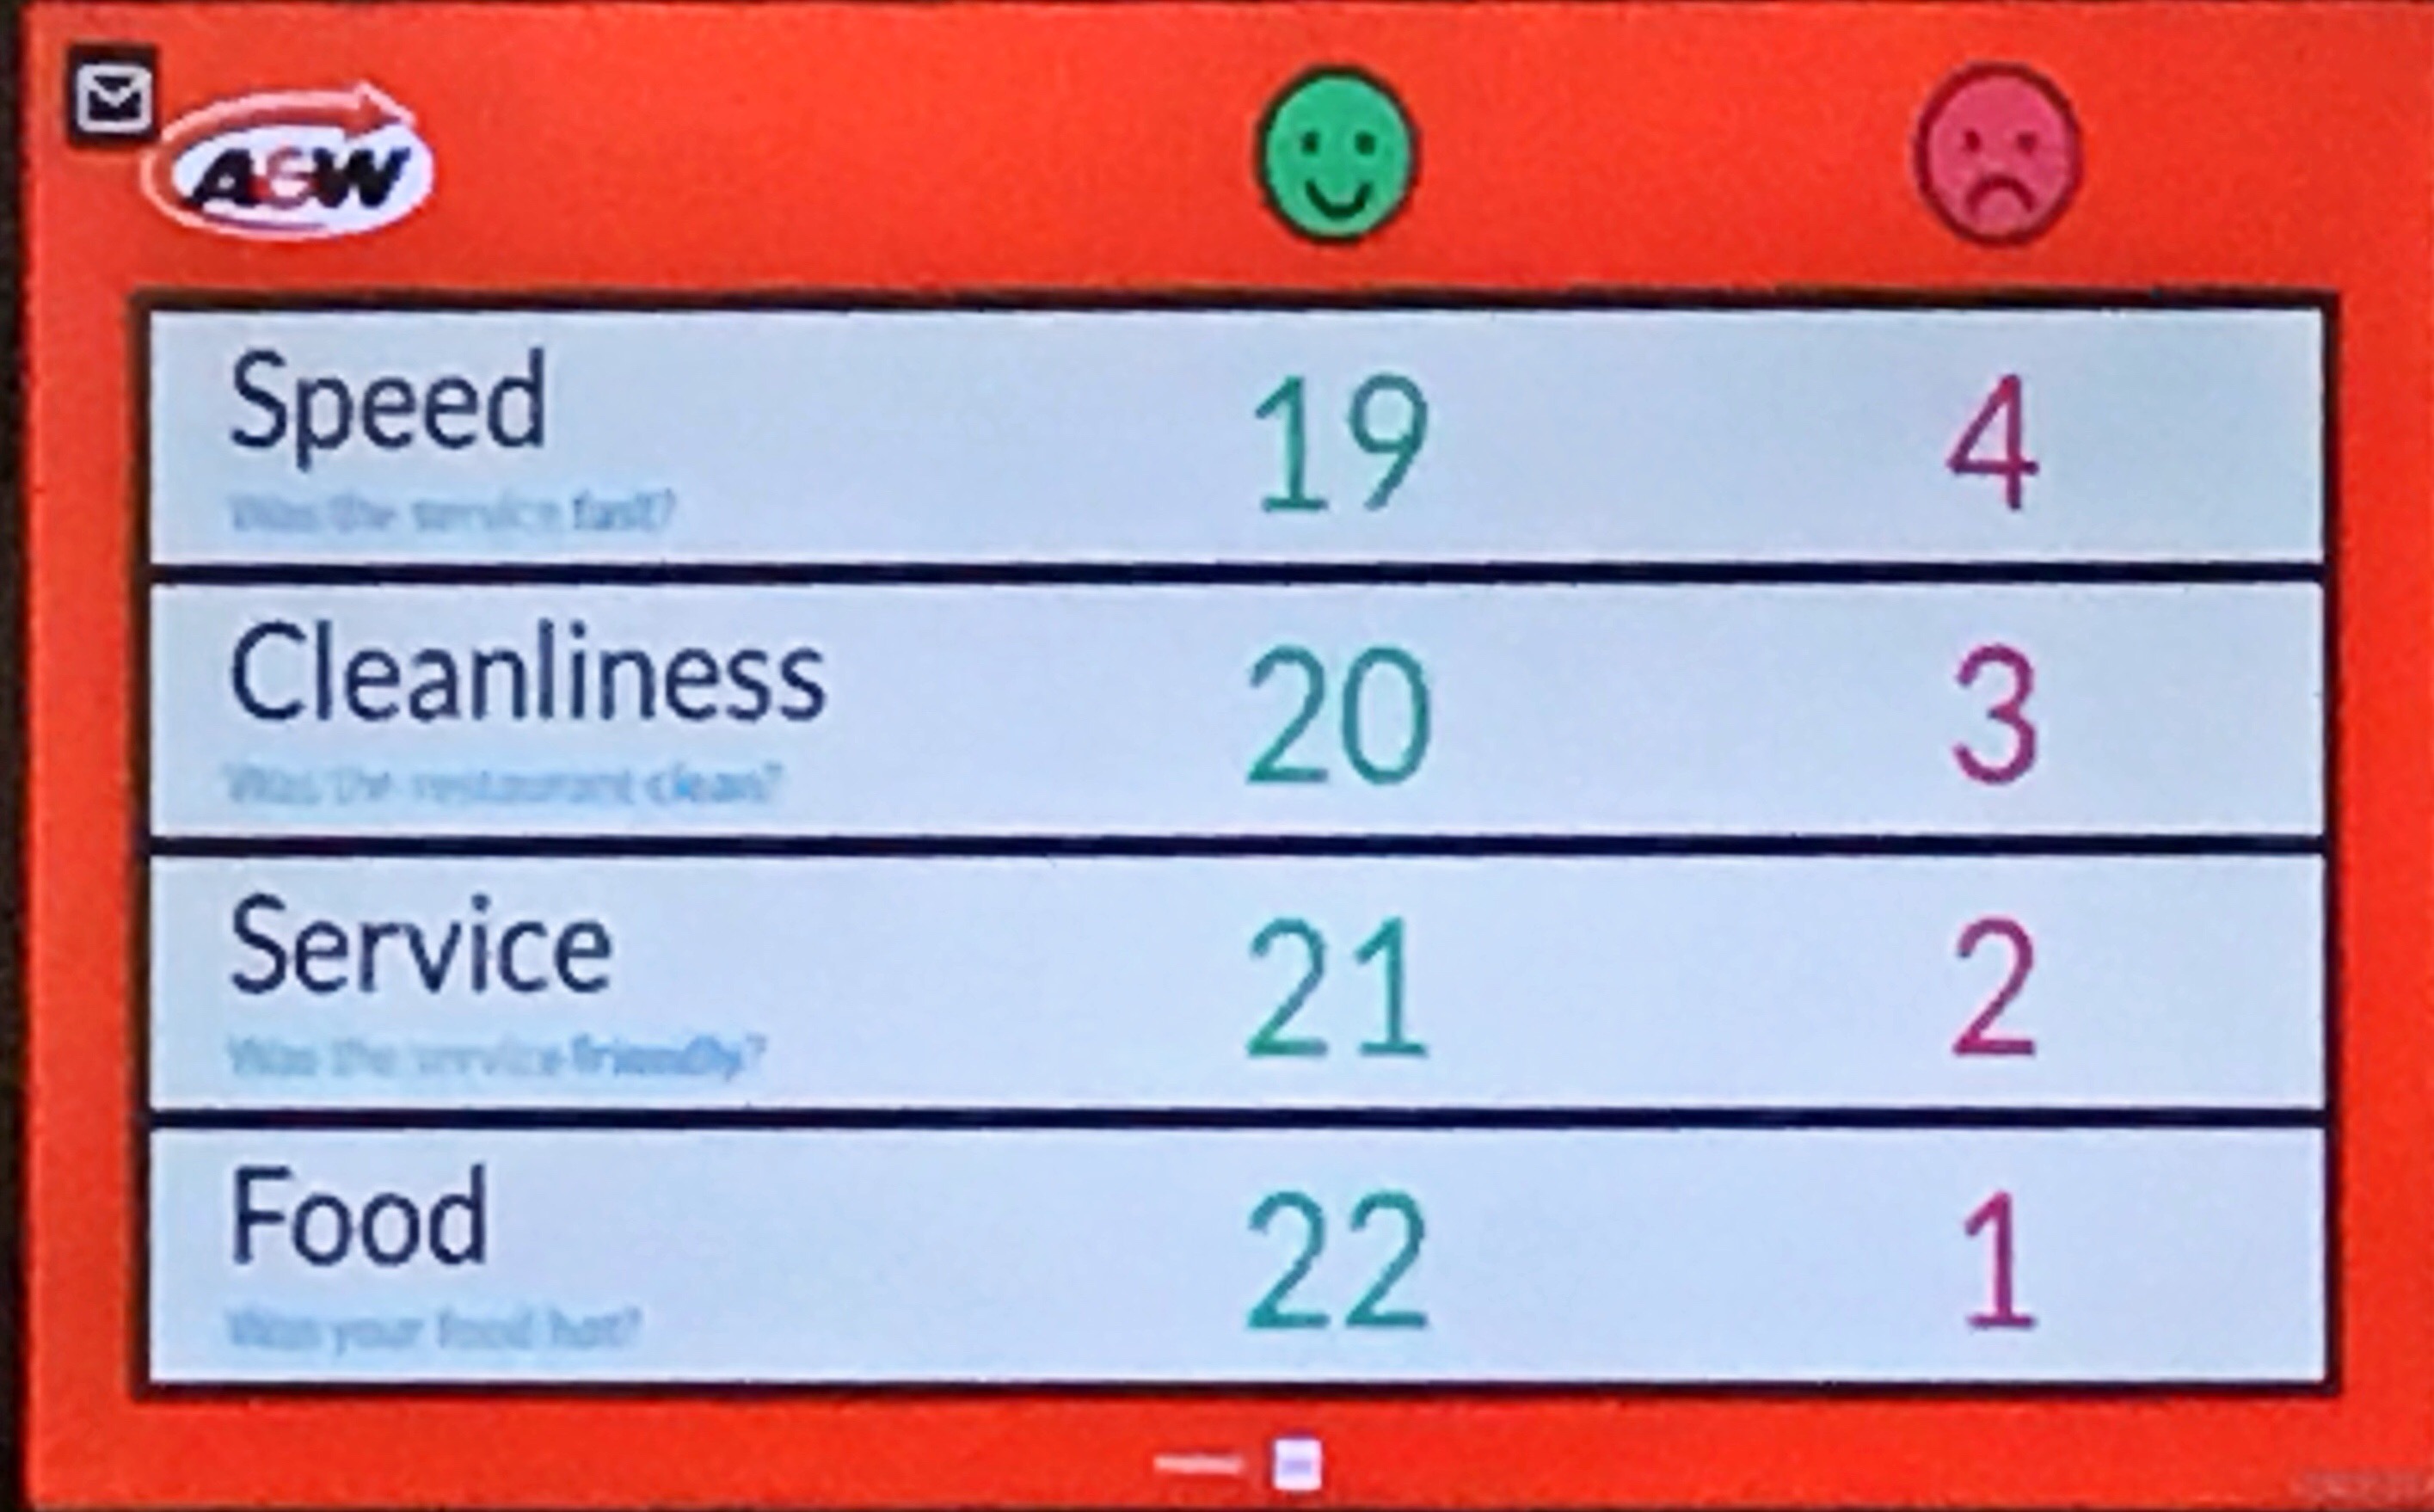
“That’s a lot of smiles,” Keira (10) said as we waited for our Teen Burgers.

“Yeah. How many?” I asked. “A lot” wasn’t going to fly with a “real-world” number talk in front of us.

“Sixty-three and nineteen is… hold on,” Keira said. She wanted to add tens and ones: three twenties is sixty and one and two make three. She knew that the nine in nineteen would make this strategy more challenging. So she took advantage of the associative property and (wisely) punted.

After a few moments Keira offered eighty-two. She explained that sixty-three and twenty make eighty-three so sixty-three and nineteen make eighty-two.

Her sister Gwyneth (13) used a different strategy. “I took one from the twenty-one and gave it to the nineteen,” she said. “That’s four twenties–ha!–and two more.”

At Graham Fletcher’s session at the Northwest Mathematics Conference in Whistler, he shared a story of one student using this strategy after engaging in his Bright Idea task: “Numbers are just Skittles now,” she said. Similarly, Gwyneth decomposed twenty-one, taking and giving one to create two landmark or friendly numbers. To Gwyneth, numbers are just smiles.

Krispy Kreme: Connecting Strategies and Models

Earlier this year, I wanted to share student work on Graham Fletcher’s Krispy Kreme three-act task with a group of intermediate teachers. When I last facilitated this task, many students thought of multiplication as repeated addition (only). Others used the standard algorithm — few successfully. At that time, analyzing student work revealed what students really understood (or didn’t). Further, the teacher and I discussed implications on practice going forward. (This prompted my last post.) But with my group of teachers I wanted to talk partial product strategies and models and these samples weren’t helpful. So Marc and I faked it and created some possible approaches:

What connections can you make between these students’ strategies?

I’m using approaches to include and differentiate strategies and models. Pam Harris defines strategies as “how you mess with the numbers” and models as how you represent your strategy. For example, I might use an open number line to model my adding up strategy for 2018 − 1984. The same adding up strategy can be represented with a different model (e.g., equation). The same open number line can represent a different strategy (e.g., keeping a constant difference).

We shared the approaches with the group and after some noticing and wondering invited them to find as many connections as they could. Some intended connections:

  • Students 1 & 5 thought of multiplication as repeated addition
  • Students 2 & 4 & 7 think place value to decompose 32 into two (or more) addends
  • Student 2 “splits” 32 symbolically; Student 7 partitions an open array
  • The partial products in Student 3’s algorithm can be seen in Student 4’s open array
  • Students 1 & 8 make use of the fact that four 25s make 100
  • Students 4 & 8 make use of halves and doubles

Teachers then discussed the placement of these approaches within a learning progression and how they might “nudge” each student.

Analyzing student work has become my favourite professional development activity. Here, what is lost in terms of authenticity is gained in terms of diversity of thinking. Still, I was excited to see this from @misskwiatkaski5‘s real students:

Krispy Kreme: Partial Products

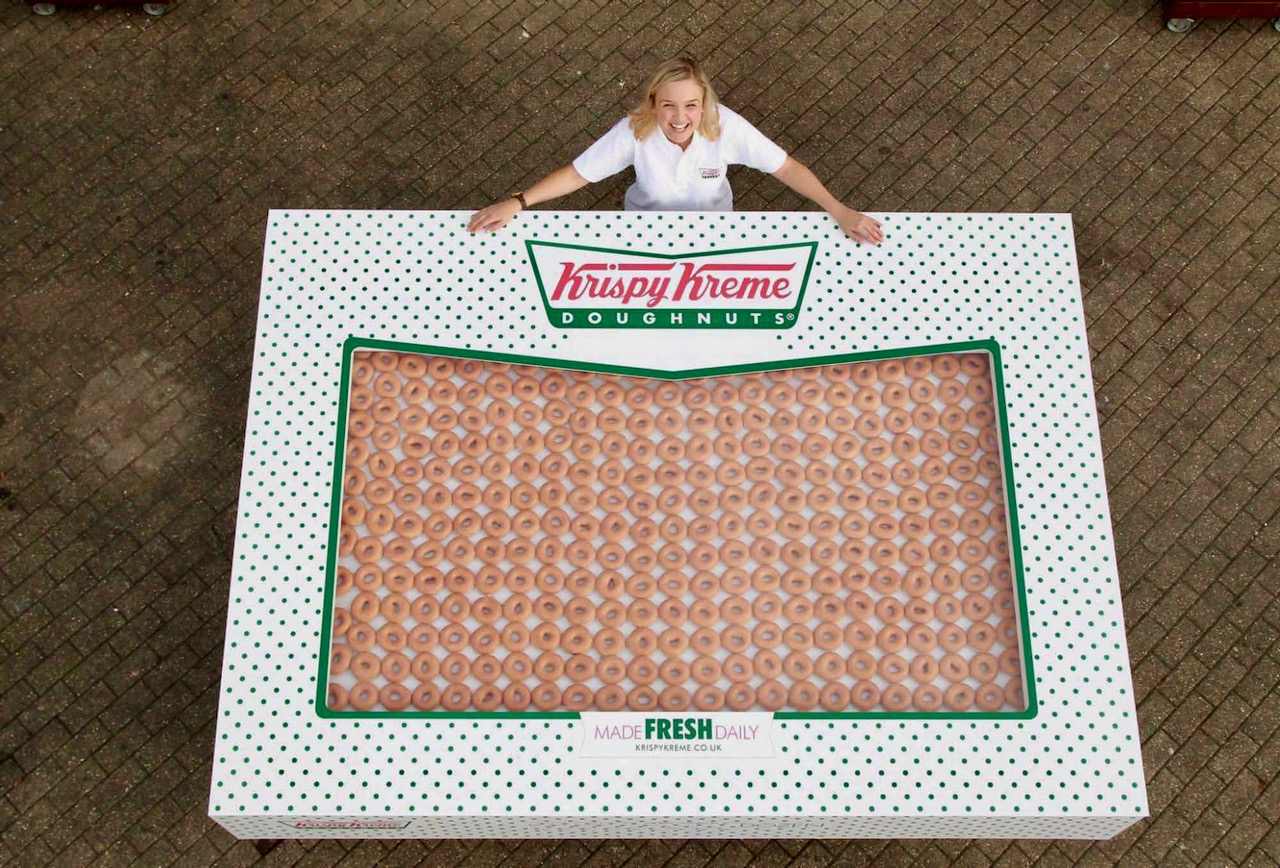
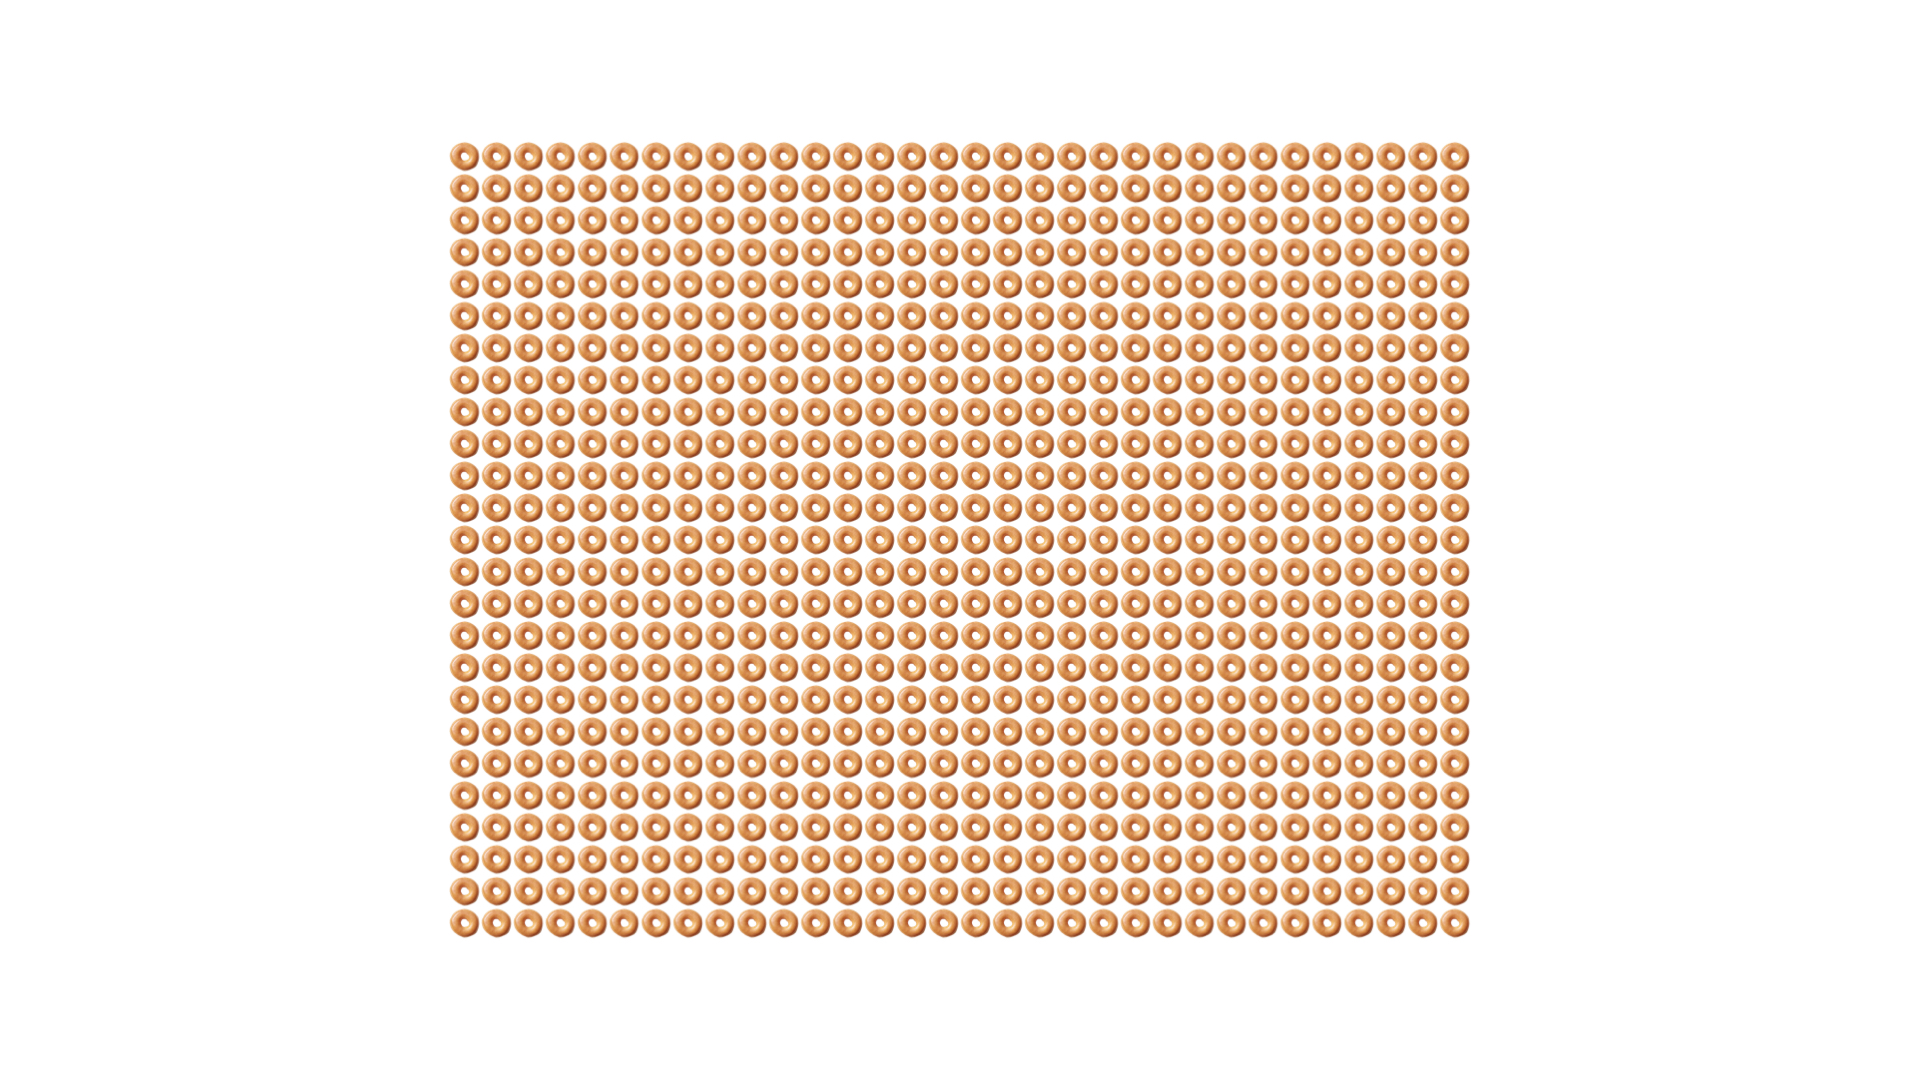
How many doughnuts are in the box?

This Krispy Kreme three-act task above–from Graham Fletcher or YummyMath–cries out for partial products.

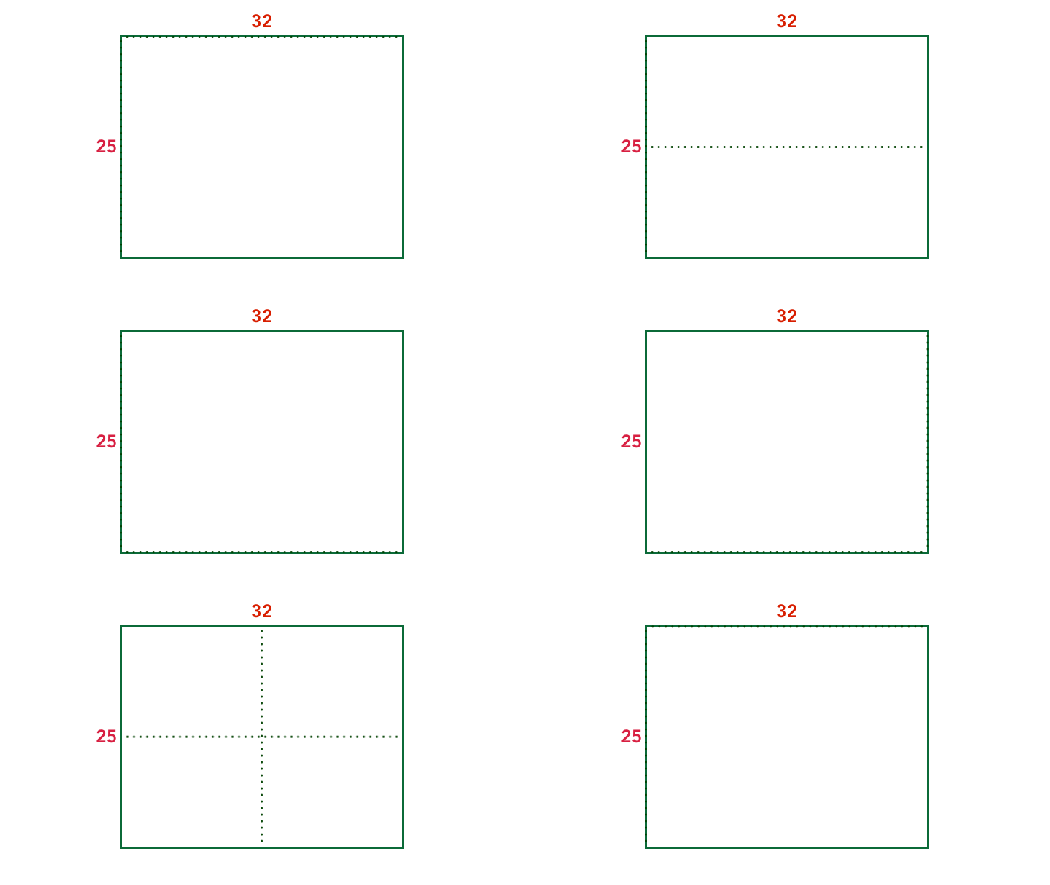
How would you partition the open array?

But more than once, the partial product strategies and models that I anticipated did not emerge. Not even close. 5 Practices-induced flop sweats. More on that in a future post. First, a progression of partial products across the grades, beginning with the basic multiplication facts:

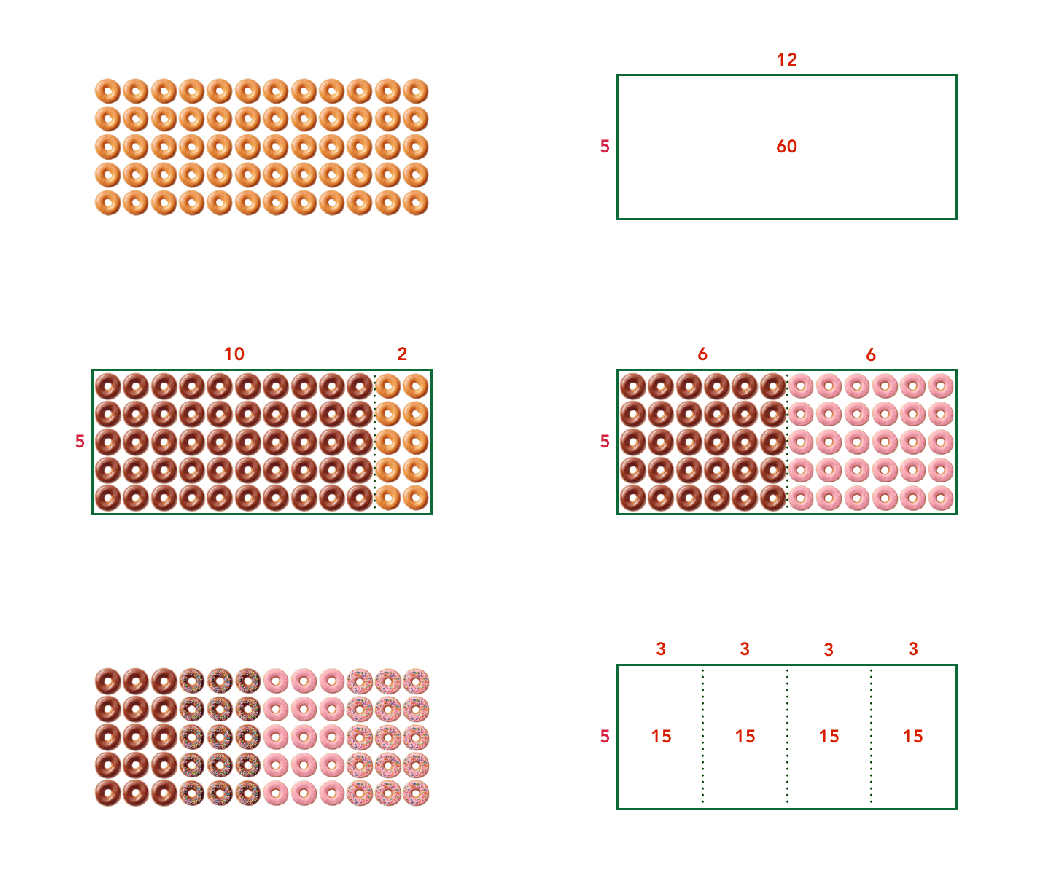
How many do you see? How do you see them?

Some students will see four rows of seven doughnuts and know that 4 ⨉ 7 = 28. Great. For students who haven’t yet mastered the basic multiplication facts, partial products are helpful. Have students use what they know. For example, they might break apart seven as five and two and then find the sum of two familiar products: 4 ⨉ 7 = 4 ⨉ (5 + 2) = (4 ⨉ 5) + (4 ⨉ 2) = 20 + 8 = 28. Or, they might double a double: 4 ⨉ 7 = (2 ⨉ 2) ⨉ 7 = 2 ⨉ (2 ⨉ 7) = 2 ⨉ 14 = 28. They might do both. They might even break a factor into more than two addends: 4 ⨉ 7 = 4 ⨉ (3 + 3 + 1) = (4 ⨉ 3) + (4 ⨉ 3) + (4 ⨉ 1) = 12 + 12 + 4 = 28. (Admittedly not the most useful relationship to help students derive this fact.) Mastery of the basic multiplication facts aside, playing with partial products–and open arrays–reinforces the big idea that numbers can be broken apart–or decomposed–in flexible ways to make calculations easier.

This idea extends to multiplying two-digit numbers by one-digit numbers:

How many do you see? How do you see them?

Some students will understand that breaking apart by place value makes calculations easier: 5 ⨉ 12 = 5 ⨉ (10 + 2) = (5 ⨉ 10) + (5 ⨉ 2) = 50 + 10 = 60. Others might use doubles and double-doubles. Note that a factor can be broken into addends or smaller factors: 5 ⨉ 12 = 5(3 + 3 + 3 + 3) or 5 ⨉ 12 = 5(3 ⨉ 4). How students choose to express this will provide insight into their thinking.

Again, decomposing numbers in flexible ways extends to larger numbers:

How many do you see? How do you see them?

Breaking apart both factors by place value is a common approach: 25 ⨉ 32 = (20 + 5) ⨉ (30 + 2) = (20 ⨉ 30) + (20 ⨉ 2) + (5 ⨉ 30) + (5 ⨉ 2) = 600 + 40 + 150 + 10 = 800. This approach might be too common if reduced to a procedure (i.e., the box method or FOIL). Again, it’s about flexible ways. Breaking apart just one factor by place value is an efficient mental math strategy: 25 ⨉ 32 = 25 ⨉ (30 + 2) = (25 ⨉ 30) + (25 ⨉ 2) = 750 + 50 = 800. A student who inefficiently decomposes 32 as 10 + 10 + 10 + 2 could be nudged towards 32 as 30 + 2. Or, a factor of 25 might spark thinking about 25 ⨉ 4 = 100, a familiar product.

The different varieties of doughnuts illustrate some helpful ways of partitioning the arrays. But each of these slides draws attention to a specific way of seeing the array. My preference would be to show the slides where all the doughnuts are the same. (Same goes for visual patterns.) Ask students how they see them. If students do not see a helpful way of partitioning the arrays, then corresponding slides with different varieties of doughnuts could be displayed. In a number string, 52 – 40 leads students to think about adjusting 39 in 52 – 39 to make the calculation easier. Similarly, a purposely crafted string of images could lead students to see fives, doubles, or place value–all useful relationships–in an original (glazed) array.

Related: The Math Learning Center’s Partial Product Finder